I’d rather be Lucky than Good
You’re a genius. You’re averaging $100 per hour at cash games. You have a return on investment of 300% for tournaments. The phone is ringing, the magazines want an interview; you’re being touted as the next Gus Hansen.
Trouble is, you’re a money-losing player – you just don’t know it yet. Poker can be a cruel game. It’s bad enough that the buzz from winning or the sense of repairing loss can be strong enough to lose some people a fortune. Worse still is the reality that many sober-headed, strong minded people with a decent sense of logic and gaming ability can delude themselves too.
Indeed, the concept of luck is one of the most universally misunderstood phenomena in everyday life. Just how many bad, or good things can happen in a certain series of events, or in a given time period, is apparently not something for which we have a keen instinct.
At the poker tables, one often hears the saying “I’d rather be lucky than good”. If you believe that bad play eventually catches up with you, and that in the long run, the luck factor will even out, you might cringe when you hear that. However, it’s not so straightforward. Will Jamie Gold, for example, ever have to repay his luck? As you’ll see from the following analysis, he would probably have to enter the WSOP main event every year for the rest of his life – and for another fifty lifetimes or so after that for his luck to start evening out a bit and show his true winning potential. In other words, as long as he sticks to the same stakes, he really would rather be lucky than good.
The question to ask therefore is: how much can luck affect one’s results either positively or negatively? To put it another way: just how much play does it take to be more or less sure that you are a money-making poker player?
The first question to ask is that of measuring success. Of course, the easiest way in poker is to count the money, but we must be sure to count it as a multiple of what was staked. There’s no point in claiming you’re a winner if you won one hand at the $5/$10 tables which wiped out your consistent losses of $900 on the $0.50/$1 tables (if this sounds dumb, believe me, people do it).
In cash games, success is often measured in multiples of the big blind per hour. I will adhere to the convention, used by the hand database application Poker Tracker, of “big bets” per hour or per 100 hands (the concept of a “big bet” – originating from limit poker – is twice the big blind). For tournaments, the term ROI (percentage return on investment) is often used. This is a player’s gross tournament winnings divided by the total buy ins plus tournament fees, expressed as a positive or negative percentage. Other measures can be used in tournaments, such as average finishes or percentage of times cashed, but the most accurate measure is ROI.
What follows is an analysis of data from three major sources. First, my own databases of cash games mined over the past few years using Poker Tracker. I’ve followed games from the $1/$2NL level all the way up to the $200/$400NL level in both Hold ‘em and Omaha. Second, the data of SNGs is provided by Sharkscope.com, which records the results of all SNGs on the major sites and collates the information into leaderboards. It also has many tools of analysis, including graphs and a rather handy tournament selector which lets you know how fishy/sharky a tournament is before you play! Third, is Bluff’s very own Pokerdb, which is a similar website for MTTs. The pokerdb not only shows each player’s entire history back to January 2006, detailing the result of each tournament, but will give a plethora of stats including average buy in, average finish and ROI.
Let’s start with Hold ‘em cash games. Exactly how good do you think a good player can be at online Hold ‘em? As you might expect, the answer varies from level to level. On the lower tables such as the $1/$2 level, it’s possible for a good player to be making up to 8BBs/100 (i.e. eight big bets per hundred hands). At the higher levels – say from $10/$20 upwards, it’s rare that a player will make over 5BBs/100. However, given that most pro players have at least three tables open at once, this could equate to nearly $300 per hour!
Surely such a money making player would not have to wait so long to confirm their prowess? Think again. The following is a graph of net winnings over 32,000 hands of a $5/$10 NL (6-max) player on Full Tilt:
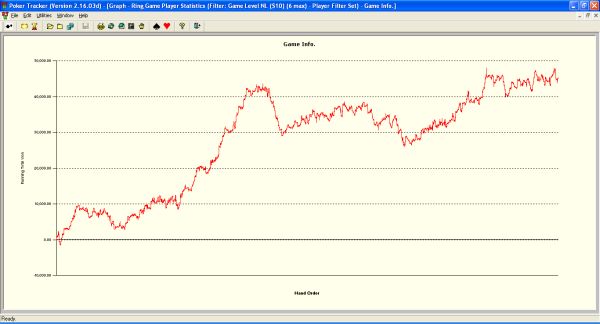
As you can see, there are some pretty big fluctuations here. Just to put you in the picture, if this player has three tables open at once, and each table averages 95 hands per hour, then the above graph represents over 100 hours of play. Look at the middle section – this player, who seems to be a money making player in the long run, has nevertheless broken even over a period of almost 20,000 hands!
It’s worth noting that style of play and type of game do affect volatility. If you’re a tight and relatively untricky player, the fluctuations will be smaller than for a loose and aggressive player, who will be more likely to risk their whole stack on quite marginal hands. In fact, the player above was exactly such a player –raising preflop well over 20% of the time. We can conclude from the graph that for such a player, even 32,000 hands are not enough. (I should say that this player is in fact money making over more hands, it’s just that the graphing capabilities of my PC using this application only went up this high!).
So how many hands is enough? Using the data from a less aggressive player than above, one can calculate the following:
|
Hands
|
Mean
|
St dev
|
Lower
profit
|
Upper
profit
|
Hands / hr
|
Lower hourly
rate
|
Upper hourly rate
|
|
100
|
$40
|
500
|
-$960
|
$1,040
|
200
|
-$1,920
|
$2,080
|
|
1000
|
$400
|
1581
|
-$2,762
|
$3,562
|
200
|
-$552
|
$712
|
|
10000
|
$4,000
|
5000
|
-$6,000
|
$14,000
|
200
|
-$120
|
$280
|
|
100000
|
$40,000
|
15811
|
$8,377
|
$71,623
|
200
|
$17
|
$143
|
|
500000
|
$200,000
|
35355
|
$129,289
|
$270,711
|
200
|
$52
|
$108
|
|
1000000
|
$400,000
|
50000
|
$300,000
|
$500,000
|
200
|
$60
|
$100
|
The player analysed here made about 5BBs/100 over 47,000 hands on the $2/$4 NLHE (6-max) tables on Ladbrokes. The two columns on the right indicate the upper and lower limit of this player’s potential hourly rate. What this means is that there’s a 95% chance that their actual hourly rate will be between those limits given what we know about how money making they are.
Scary stuff isn’t it? We know that the average rate assuming that they play 200 hands per hour is $80 per hour. However, you can see from the table that even after 10,000 hands, their hourly rate could be anything from $-120 to $280 per hour. In fact, the figures don’t really settle down to giving us a decent picture of how well they “should” be doing until getting on for 500,000 hands. That’s 2,500 hours at 200 hands per hour!
The picture isn’t too different for tournaments, either. In fact, if anything there’s more volatility in tournaments because the latter stages (especially the last three positions) are where all the money is. Thus, a specific piece of bad or good luck can have a tremendous bearing on your overall results.
Most people understand the concept that any old muppet can win a tournament, but the reality is that, if that muppet plays enough, they can win two or three, or certainly show a good run of results. This is usually enough for the poker media to go apoplectic (especially if the player is good looking, young and female) and the new talent tends to get hyped beyond all sense of sanity.
With this borne in mind, let’s have a look at what the reality is for volatility in results for tournaments. We’ll start with SNGs. The following is a graph showing the results since the beginning of 2007 of one of the best online SNG players around. The data has been limited to $110+9 buy in nine-player turbos on Full Tilt. The player has entered over 20,000 SNGs at this level.
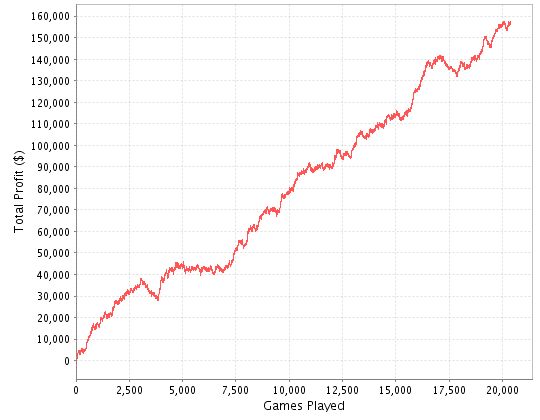
As you can see, this is clearly a money-making poker player. They average a profit of $7.67 per tournament, which is an ROI of 6.4%. Even with that long-term profitability, this player has on two occasions broken even for no less than 3,000 games. They have also twice suffered a downswing of $10,000 (equivalent to about 100 buy ins).
Those of you who thought that they were definitely money making after having posted a significant win over 250 tournies might want to think again. Look at the graph – your sample set is a blip of just one tenth the distance between the gridlines!
It should be noted that these are turbos, which suffer from some quite amazing volatility – it is very difficult to make skill tell in a big way when you have to commit with your A-3 suited on the bubble and get called by A-4 offsuit. However, game level will also have a bearing on volatility. If you’re playing $20 or $30 buy ins for example, the chances are you’ll be up against a field who aren’t too clued up. Even in a turbo, you can make the superior skill pay. It’s interesting that many players can achieve ROIs of well over 10% at this level, whereas at the $110 level, almost no one posting results for more than 1000 tournies can achieve that much.
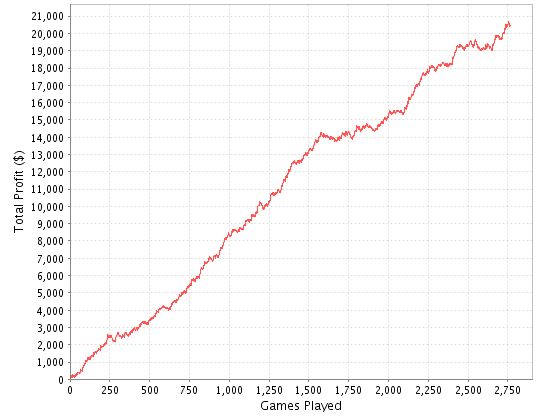
Still, the figures for non-turbos at lower levels don’t tell a hugely different story. Here’s a player from the Ongame network who seems to be one of the best at $20 or $30 buy in 10-player non turbos:
Now the downswings are only about 30-50 times the buy in, and the break even periods seem to stretch no further than about 500 games.
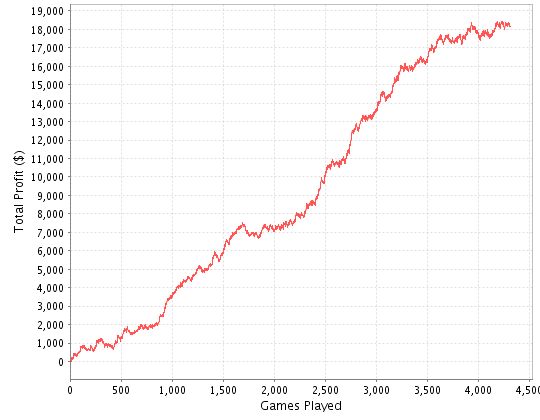
Game type is another factor. As noted in my article “Is the money disappearing out of Hold ‘em?” different games can provide players with different edges – especially if the opposition is weak. One of the games that confers the biggest edge of a good player over a bad is Omaha Hi-Lo. Unfortunately, as the game is played so rarely, the sample set for this is a bit smaller. Even for the best online SNG Omaha Hi-Lo player, we only have data for about 3000 non-turbo $30 buy ins:
Note that the volatility is much lower here. The line is pretty straight; the maximum downswing seems to be only about 20 buy ins, and the break even periods no more than 300 tournies. But if anything can bring it home, this should: the most winning player of a game where one’s edge can tell more than Hold ‘em, playing low buy in, non-turbo SNGs, can still suffer break even periods of over 300 tournaments.
Multi-table tournaments, by virtue of how skewed the prizes are in favour of the top three positions, show the greatest volatility of all. The following graph was created by lifting the data from thepokerdb.com into an Excel spreadsheet for Jon Turner (aka PearlJammed) – who is the highest winning online MTT player in the world right now:
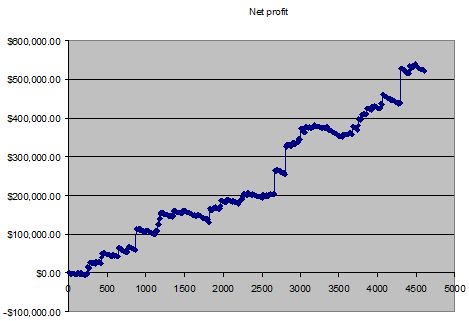
The volatility cannot be treated in precisely the same way as the SNG data here because this data contains results from $1000 buy in tournaments all the way down to $10 ones. However, the principle is the same: there are some huge jumps where there has been a major cash win, and then many long, steady, perhaps even downward sections. The sample set is over 4,500 tournaments played since early 2007. You can see that if you were to choose one particular 500-game run at random, it might be one showing a significant loss, or one showing a $100,000 profit.
In fact, if you normalise the data to plot a graph showing how far away from his expected result (over this whole sample of 4,500 tournaments) PearlJammed is, the graph looks like this:
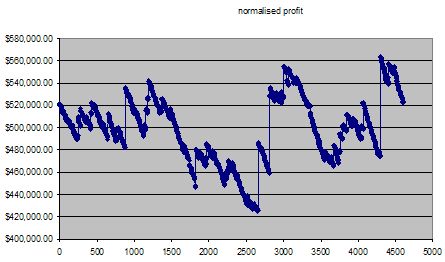
At a little over 2,500 tournaments played, PearlJammed is almost $100,000 below his expectation over the whole sample set. Even after 4,000 tournaments, his expectation swings approximately $50,000 both above and below the norm.
The lessons learned from this are quite straightforward. First and foremost, the luck factor in poker is significantly greater than most people think. It’s so big, in fact, that many players who blithely assume that they are making money have got a big surprise in store. By the same token, many players who are currently losing have a nice surprise in store too.
The volatility itself is contingent on a number of things. First, results in cash games, by virtue of the consistent blind levels, will even out to a norm more quickly than those of tournaments. You’ll have less volatile results if you’re tight and relatively risk-averse too. SNGs in turn are less volatile than MTTs, providing they are not turbos. If anything, turbos are the most volatile of all. The game you play will affect things too. A game where you can have a significant edge over your opponent – such as Omaha Hi-Lo – figures to show less long-run volatility than the equivalent Hold ‘em game. However, all of this is contingent on the level you play and the opposition you choose. At a higher level, you figure to be up against better players, where your edge will be diminished; and with a diminished edge, once again volatility increases.
All of which calls into question why people play poker in the first place. If it’s about being respected as a good player, then you probably would be happier being Allen Cunningham than Jamie Gold. However, if it’s about the money, unless you’re thinking of devoting a lifetime to poker (and in some extreme cases, fifty lifetimes), you’d rather be lucky than good.
With thanks to Dan Shavick, author of No Limit Texas Hold ‘em for Winners.