Expert Heads Up No Limit Hold’em: Excerpt 3
This is the third excerpt from Will Tipton’s book Expert Heads Up No Limit Hold’em Vol 1: Optimal and Exploitative Strategies. The book is on sale at www.dandbpoker.com from 14th of December 2012.
Excerpt 3
Expert Heads Up No Limit Hold’em
by Will Tipton
The very simplest HUNL game is preflop shove/fold. Its tree is shown in Figure 3.1, and we have labelled the SB’s payoffs at each leaf. First, the SB can either fold or shove, and, if he shoves, the BB can either call or fold. Since each player has just one decision point with two options, only two ranges are needed to fully specify the players’ strategies: the SB’s shoving range and the BB’s calling range. Most of our discussion of this game will focus on very short stacked situations since that is where it might best approximate real play.
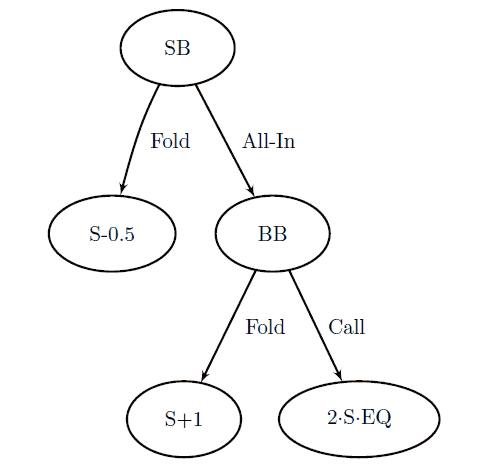
Figure 3.1: Decision tree of the shove/fold
game. The total expected SB stack size is
written on each leaf where S is the players’
starting stack size and EQ refers to the
SB’s equity versus the BB’s range.
We will neglect a detailed explanation of the process of finding solutions for this game and most others in this book. However, working through some of the calculations yourself can be helpful since an understanding of the process is important for developing intuition about game-theoretic play. Review Chapter 2 if it has gotten fuzzy.
GTO ranges for the shove/fold game depend on the effective stack size. There is a compact way to show ranges at all stack sizes. We use a table which is labelled A-2 horizontally and vertically so that each square represents a hand. For example, the top left square represents A-A. You might notice that each non-pair hand is represented twice in this construction. For example, AK is both to the left of and directly below A-A. We use this doubling of non-pair hands to indicate suitedness: hands listed above the diagonal (that is, those on the upper-right portion of the table) are suited, and those below the diagonal are unsuited. In the square corresponding to each hand, we indicate the stack sizes for which the hand is contained in the range. Thus, we can represent the range at all stack sizes in a single chart.
This representation has a couple of disadvantages. We can not distinguish between hands which differ only by suits (e.g. Q -J and Q
 -J), but this is unimportant preflop. We also can not express situations where a hand is only fractionally in a range, i.e. where a hand is played sometimes one way and sometimes another. These are the prices we pay for having a compact way to express the information. In this way, we show the GTO SB shoving ranges in the shove/fold game for stack sizes up to 100 BB in Figure 3.2. Similarly, BB calling ranges are shown in Figure 3.3. The numbers in the squares indicate those stack sizes for which a given hand is in the range. Single numbers in the table indicate that the corresponding hand is contained in the range at all stack sizes up to that number. These tables were generated by solving the game at stacks from 1 to 100 BB in intervals of 1/10BB. To deal with cases where hands are fractionally contained in the ranges, we indicate that a hand is in the range if it is with frequency greater than 50 percent.
There are also a number of cases where a hand’s occupancy in a range does not go quickly and smoothly from 1 to 0 at any particular threshold stack size. It fluctuates up and down, passing the 50% mark several times. This is illustrated in Figure 3.4 where we show the fractions of a particular hand in the equilibrium SB shove range with respect to stack size. In these cases, we pick a representative value for the sake of the chart or, when no such single value can be chosen, indicate several ranges of values. Much more care has been taken to maintain the details of the solutions at low stack sizes where they are likely to be used in real play.
SB shoving ranges
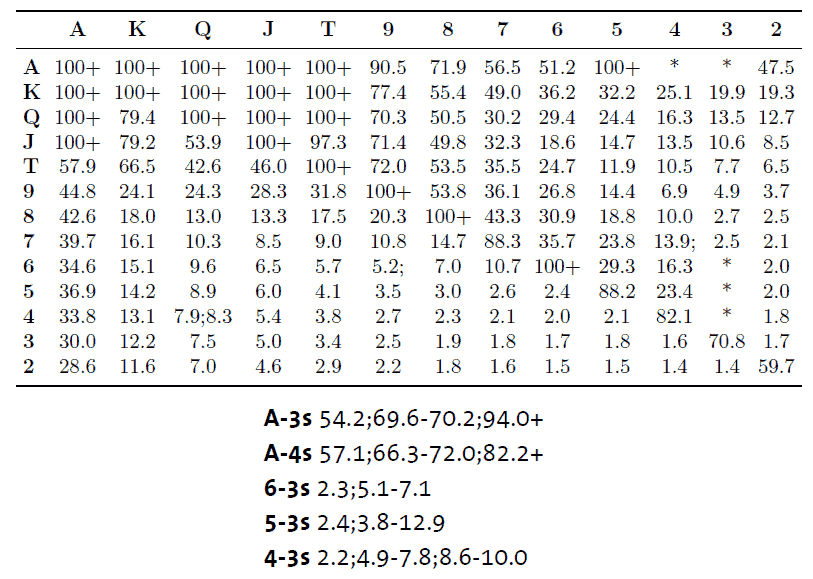
Figure 3.2: Table representation of SB’s shoving range in the GTO solution of the shove/fold game at different stack sizes.
BB calling ranges
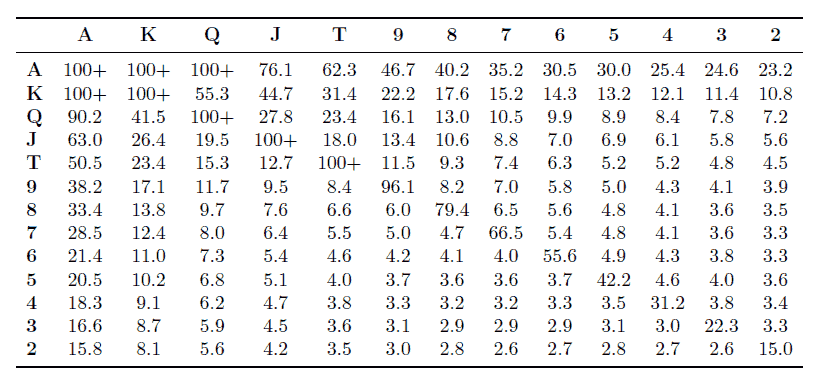
Figure 3.3: Table representation of BB’s calling range in the GTO solution of the shove/fold game at different stack sizes.
Fraction of 43s in SB shoving range in GTO shove/fold

Figure 3.4: Occupancy of 4-3s in the equilibrium SB shoving range for the shove/fold game with respect to effective stack size.
Remember the meaning of these GTO solutions. Each player is playing most profitably given the strategy of his opponent. Neither player can unilaterally change his play to improve his expectation. In practical terms, this means that if the SB shoves with a particular hand at a certain stack size, then that is because shoving it is at least as profitable as folding it when facing an opponent playing unexploitably. If this were not the case, then the SB could unilaterally improve his expectation by folding that hand instead of shoving it. Similarly, the BB is playing all of his hands in the way which is most profitable versus the SB’s GTO shoving range. This is a point of frequent confusion about Nash equilibrium strategies. Although it is true that if Villain deviates from equilibrium play, these unexploitable ranges are no longer maximally exploitative, it is still the case that Villain could only have lowered his expectation by deviating.